Brewblox
Grafana
UI graphs and CSV exports provide a convenient and straightforward way to view history data. For notifications or more advanced data analysis, you can install and use Grafana.
Installation
If you already have Grafana installed, you can skip this step, and immediately go to Setup.
We'll add the grafana service to docker-compose.yml. It will then run alongside the other Brewblox services.
First, we need to create the directory where grafana stores its configuration.
Go to your Brewblox directory (default ~/brewblox), and run these commands:
mkdir -p ./grafana
sudo chown -R 472 ./grafana
Then edit your docker-compose.yml file, and add the following configuration under services. As always with YAML files, indentation matters.
  grafana:
    image: grafana/grafana
    restart: unless-stopped
    volumes:
      - ./grafana:/var/lib/grafana
    environment:
      - "GF_SERVER_SERVE_FROM_SUB_PATH=true"
      - "GF_SERVER_ROOT_URL=http://localhost:3000/grafana"
Example compose file
version: "3.7"
services:
  spark-one:
    image: ghcr.io/brewblox/brewblox-devcon-spark:${BREWBLOX_RELEASE}
    privileged: true
    restart: unless-stopped
    command: --name=spark-one
  grafana:
    image: grafana/grafana
    restart: unless-stopped
    volumes:
      - ./grafana:/var/lib/grafana
    environment:
      - "GF_SERVER_SERVE_FROM_SUB_PATH=true"
      - "GF_SERVER_ROOT_URL=http://localhost:3000/grafana"
Now start your services:
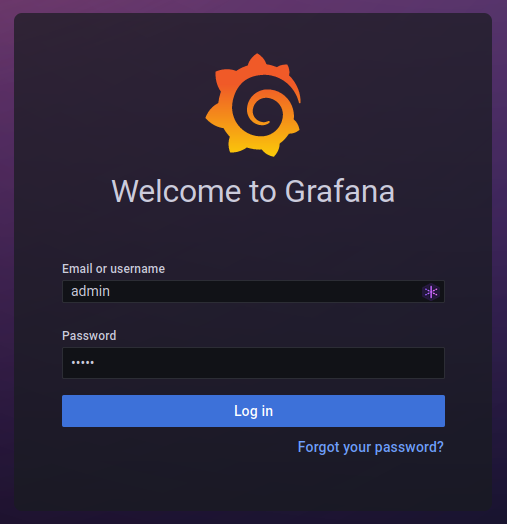
brewblox-ctl upIf you navigate to http://{ADDRESS}/grafana, you will be greeted by a login screen. The default username and password are admin / admin.
Setup
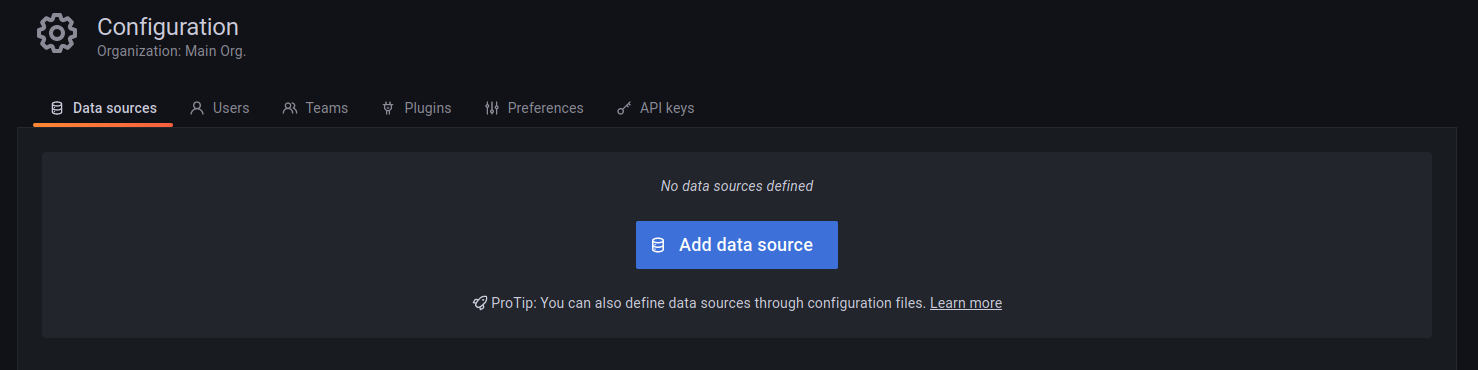
To use history data, we must add the Brewblox history database as data source.
To do so, click on the cog wheel in the left sidebar. Then, in the Data sources tab, click the Add data source button. Here, select the Prometheus option.
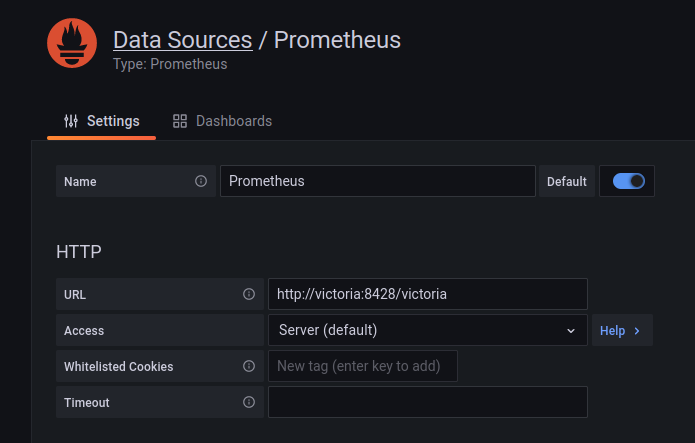
The HTTP URL field must be http://victoria:8428/victoria. All other values can be left default.
TIP
Grafana can also be installed somewhere else, as long as it can reach your Brewblox service host.
Change the data source URL to http://{ADDRESS}/victoria. If you want to use HTTPS, enable the Skip TLS Verify option.
Queries
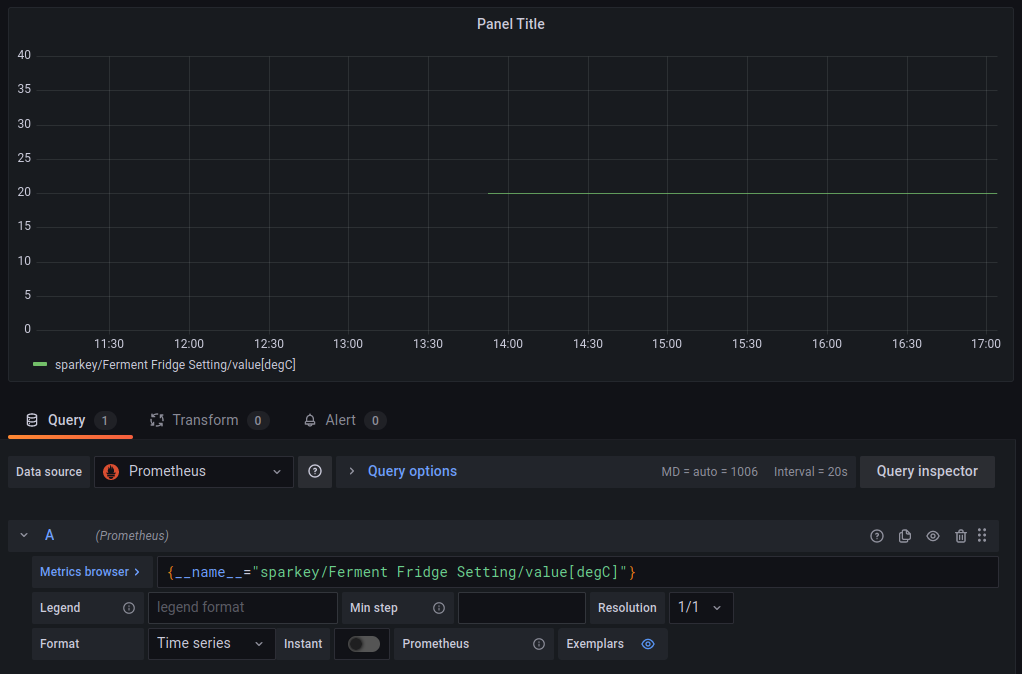
If you add a new panel, and select the newly added data source, it will prompt you for a PromQL query.
Click on the Metrics browser button to show a list of known fields.
Because it is common for Brewblox fields to contain spaces, the resulting selector is often invalid.
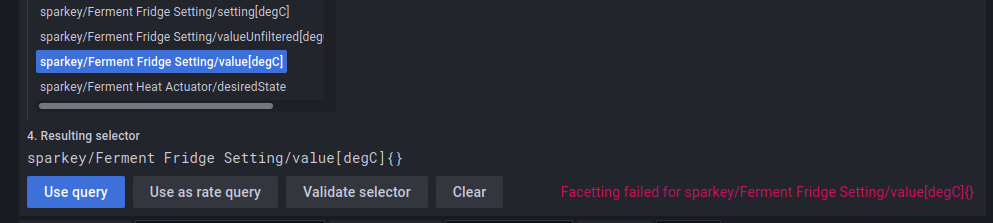
You can fix this by using the __name__ argument inside the {} brackets.
BAD: service/block name/value{}
GOOD: {__name__="service/block name/value"}